
Thinking about what to do with your International Business Machines shares, or maybe considering jumping in? You are not alone. Lately, IBM’s stock has been on quite a ride, catching the attention of analysts and everyday investors alike. Just this past month, the price shot up 18.7%, and year-to-date performance now stands at a very robust 30.4%. That is a far cry from the old Big Blue many remember as a slow mover. With long-term gains like 163.4% over three years and 183.3% in five, there is no denying that momentum is real.
What is powering this story? Recent headlines give us a clue. IBM’s ambitious moves in quantum computing have earned it a leading spot in a high-stakes tech race, while strategic changes such as the recent departure of a top AI executive to Citi point to the company’s ongoing transformation. There has also been discussion about the tech industry’s broader role in enabling digital infrastructure globally, keeping IBM’s name in the headlines and on investors’ minds.
But price alone does not tell you if a stock is still a good deal. Now for the big question: Is IBM undervalued, fairly priced, or getting ahead of itself? Based on a systematic look at six key valuation checks, IBM gets a valuation score of just 1, meaning it is undervalued by only one of those measures. That hardly screams “bargain,” but as you will see, different valuation approaches can give very different answers. Read on to explore how each metric stacks up, and stick around for an even deeper way to judge whether IBM stock is worth your next move.
International Business Machines scores just 1/6 on our valuation checks. See what other red flags we found in the full valuation breakdown.
Approach 1: International Business Machines Discounted Cash Flow (DCF) Analysis
The Discounted Cash Flow (DCF) model estimates a stock’s true value by projecting a company’s future cash flows and then discounting them back to today’s dollars. For IBM, this involves taking its current and expected free cash flows over the next decade, adjusting for the time value of money, and comparing the result to the stock’s price.
IBM’s latest twelve-month Free Cash Flow stands at $11.48 billion. Analyst consensus projects this figure rising each year and reaching almost $24.13 billion by 2035. Over the next five years, where analyst coverage is strongest, expectations predict Free Cash Flow will grow from $14.67 billion in 2026 to $18.73 billion by 2029. Beyond that point, forecasts are extrapolated rather than based strictly on analyst estimates. All projections are denominated in US dollars.
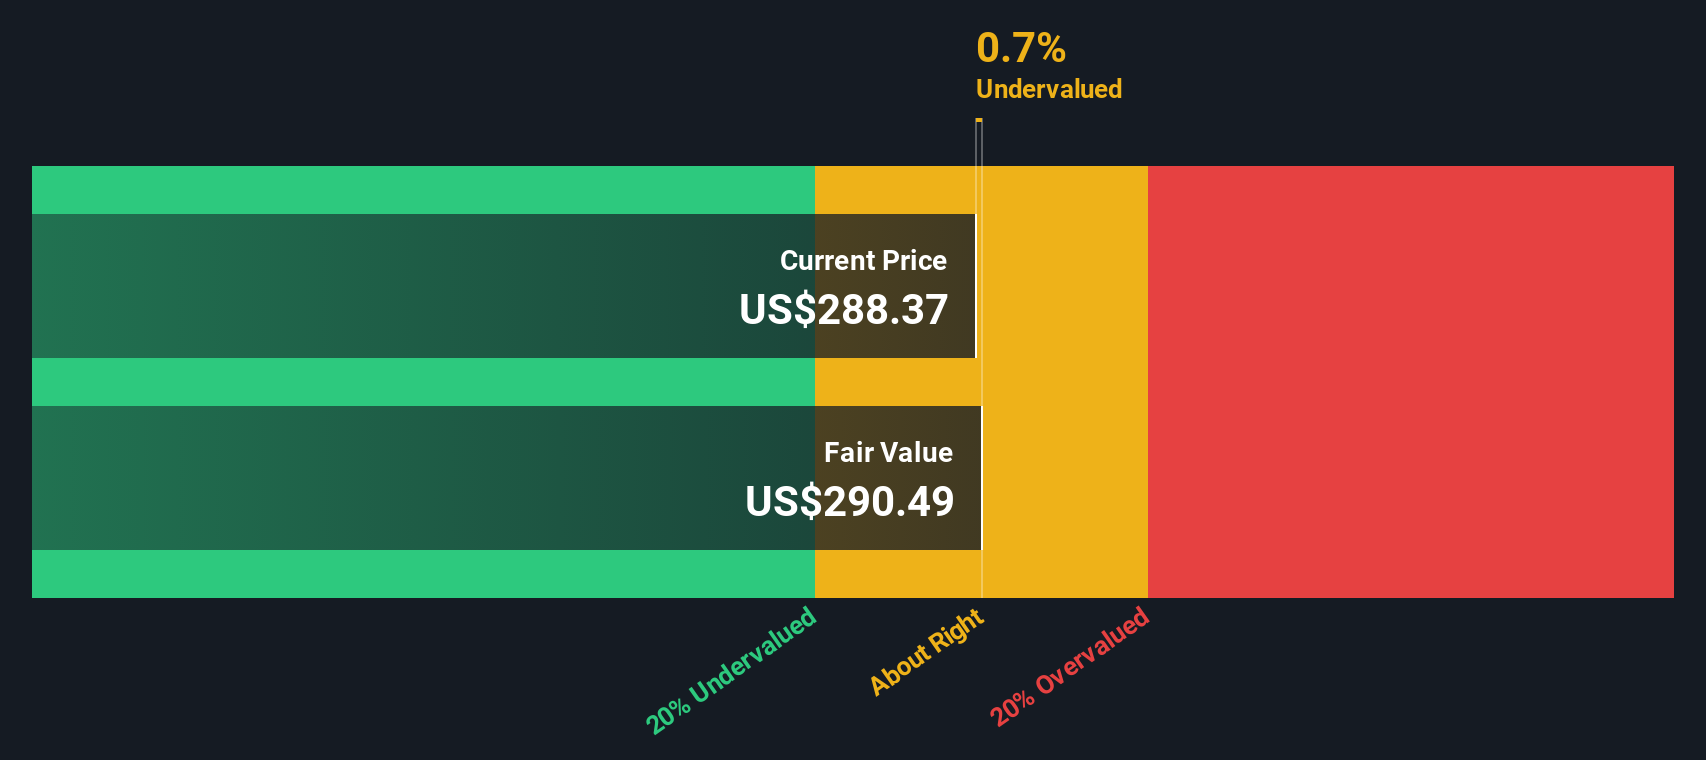
Bringing these cash flows back to present value, the DCF model calculates IBM’s intrinsic value at $291.03 per share. This result implies the stock is only about 1.5% undervalued compared to its current price. In summary, IBM appears to be trading at just about its fair value today based on this method.
Result: ABOUT RIGHT
Head to the Valuation section of our Company Report for more details on how we arrive at this Fair Value for International Business Machines.
Simply Wall St performs a valuation analysis on every stock in the world every day (check out International Business Machines’s valuation analysis). We show the entire calculation in full. You can track the result in your watchlist or portfolio and be alerted when this changes.
Approach 2: International Business Machines Price vs Earnings
For profitable companies like International Business Machines, the price-to-earnings (PE) ratio is a tried-and-true way to evaluate valuation. The PE ratio tells investors how much they are paying for each dollar of earnings and is especially helpful for companies generating consistent profits.
However, what counts as a “normal” or “fair” PE ratio can change significantly depending on a company’s expected growth, its profit margins, and the level of risk tied to its business. Fast-growing businesses or those with a steadier stream of profits typically command higher PE ratios, while more established or riskier firms tend to warrant lower ones.
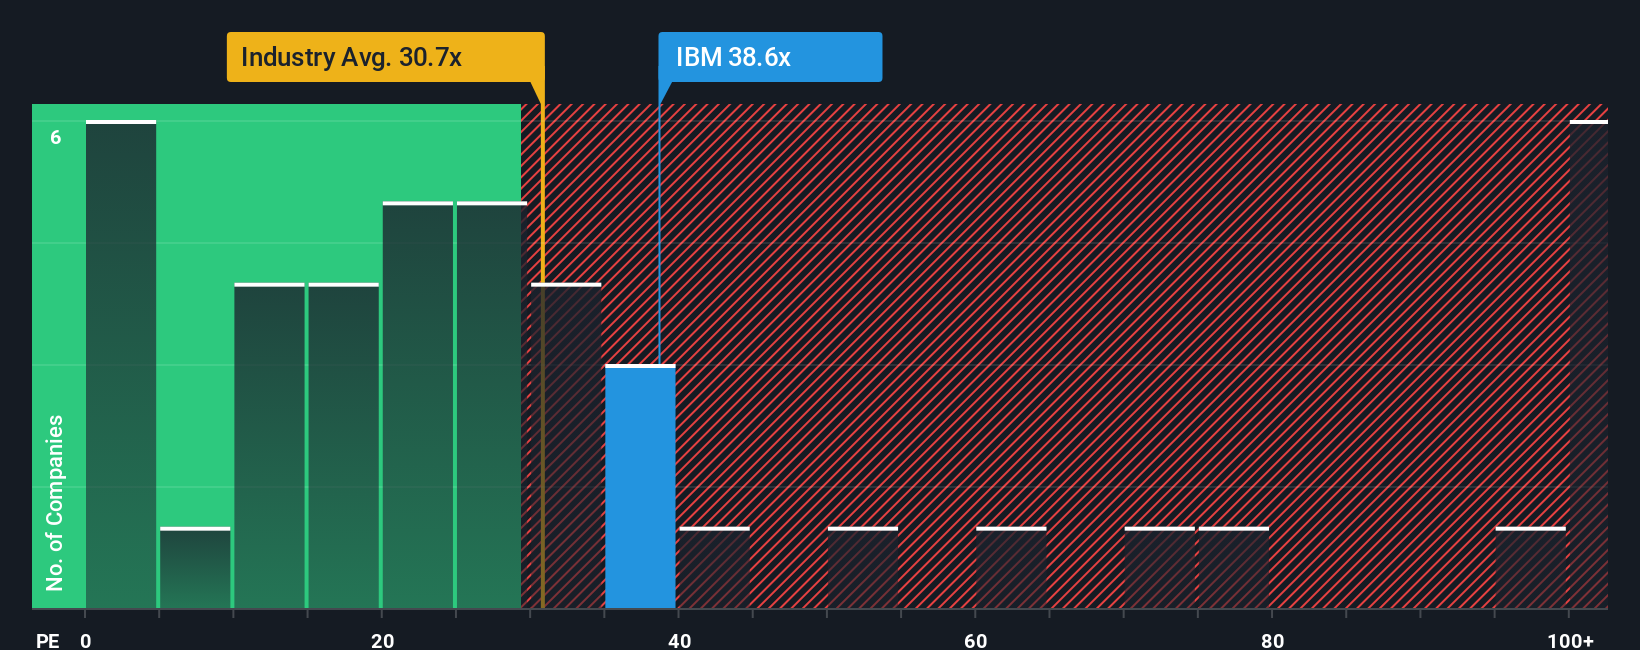
As of now, International Business Machines trades at a PE multiple of 45.6x. For context, this is well above both the average among its peers (16.2x) and the broader IT industry average (32.7x). On the surface, this looks expensive, but there is more to consider.
This is where Simply Wall St’s Fair Ratio comes in. Instead of comparing only to industry and peers, the Fair Ratio estimates the PE multiple that is truly justified, factoring in IBM’s growth prospects, profit margins, industry, market cap, and risk profile. In IBM’s case, the Fair Ratio is calculated at 43.3x, which is only slightly below its actual PE. This narrow difference suggests the market price is very close to justified given IBM’s unique circumstances.
Result: ABOUT RIGHT
PE ratios tell one story, but what if the real opportunity lies elsewhere? Discover companies where insiders are betting big on explosive growth.
Upgrade Your Decision Making: Choose your International Business Machines Narrative
Earlier we mentioned there is an even better way to understand valuation, so let us introduce you to Narratives. A Narrative is a simple story that you, as an investor, can use to connect your own view of International Business Machines, its products, innovations, challenges, and opportunities, with key assumptions about its future revenue, earnings, and margins. Where traditional metrics provide numbers in isolation, a Narrative links the company’s real-world story to a specific financial forecast and ultimately to an estimated fair value.
With Simply Wall St’s Community page, Narratives are accessible and easy to use. Millions of investors already rely on them to clarify their decisions about when to buy or sell. By comparing the Fair Value derived from your Narrative to the current share price, you get a clear signal on whether the stock is undervalued or overvalued under your scenario. In addition, Narratives update automatically whenever fresh facts emerge from company news or earnings releases, so your view stays aligned with reality.
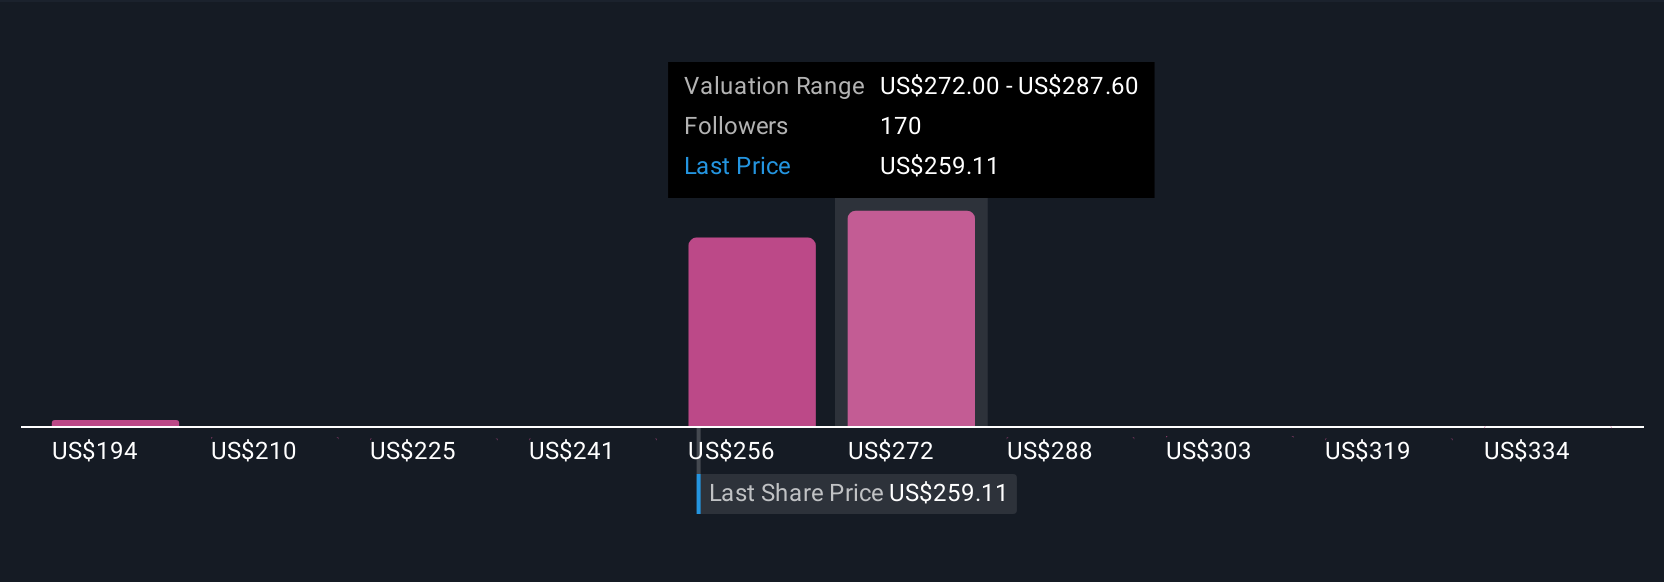
For example, right now the most optimistic IBM Narrative values the stock at $350, while the most cautious puts it at just $198. Your personal view could fall anywhere in between, depending on your story for the company’s future.
For International Business Machines, we make it easy for you with previews of two leading International Business Machines Narratives:
🐂 International Business Machines Bull Case
Fair Value: $350.00
Current discount to Fair Value: 18.0%
Expected Revenue Growth: 6.1%
The bullish case focuses on rapid adoption of AI, hybrid cloud solutions, and digital modernization, especially in regulated industries. This positions IBM for long-term growth and profitability. The integration of Red Hat, HashiCorp, and advanced innovations in quantum computing and automation is expected to boost high-margin software revenue and support a premium valuation. Potential risks include declining legacy revenues, strong competition, talent and open-source disruption, and elevated debt levels. However, the view is that IBM’s strategic strengths and innovations outweigh these challenges. 🐻 International Business Machines Bear Case
Fair Value: $281.32
Current premium to Fair Value: 1.9%
Expected Revenue Growth: 5.1%
The consensus case highlights growth through hybrid cloud, AI, and strategic acquisitions, but remains cautious regarding IBM’s ability to expand margins and maintain client trust in a changing IT landscape. Investments in advanced technologies and disciplined cost management are seen as supporting resilient margins and cash flow in a competitive and uncertain macroeconomic environment. Risks include macroeconomic headwinds, volatility in consulting and software demand, currency fluctuations, and competitive pressures. These factors result in a more reserved outlook on share price upside.
Do you think there’s more to the story for International Business Machines? Create your own Narrative to let the Community know!
This article by Simply Wall St is general in nature. We provide commentary based on historical data
and analyst forecasts only using an unbiased methodology and our articles are not intended to be financial advice. It does not constitute a recommendation to buy or sell any stock, and does not take account of your objectives, or your
financial situation. We aim to bring you long-term focused analysis driven by fundamental data.
Note that our analysis may not factor in the latest price-sensitive company announcements or qualitative material.
Simply Wall St has no position in any stocks mentioned.
New: AI Stock Screener & Alerts
Our new AI Stock Screener scans the market every day to uncover opportunities.
• Dividend Powerhouses (3%+ Yield)
• Undervalued Small Caps with Insider Buying
• High growth Tech and AI Companies
Or build your own from over 50 metrics.
Explore Now for Free
Have feedback on this article? Concerned about the content? Get in touch with us directly. Alternatively, email editorial-team@simplywallst.com