International Business Machines Corp. IBM will be reporting its first-quarter earnings on Wednesday. Wall Street expects $1.40 in EPS and $14.40 billion in revenues as the company reports after market hours.
The stock is up 32.22% over the past year and 9.53% year to date, but has cooled off recently with a 3.04% dip over the past month.
Let’s examine the charts for IBM stock and how it currently compares to Wall Street estimates.
Read Also: Top Wall Street Forecasters Revamp IBM Expectations Ahead Of Q1 Earnings
IBM Stock Trend Is Flat Ahead Of Q1 Earnings
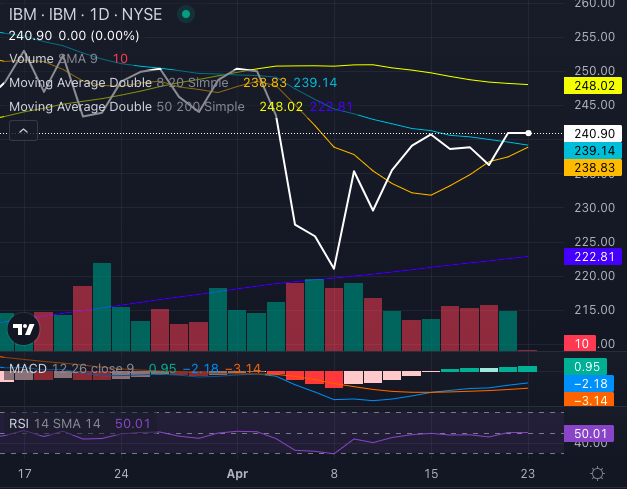
Chart created using Benzinga Pro
Technically, IBM stock is moving in a flat trend with a light bullish undertone. With the share price of $240.90 above its eight-day and 20-day simple moving averages of $238.83 and $239.14, respectively, near-term momentum looks constructive.
Adding to that, IBM’s share price remains well above the 200-day simple moving average of $222.81 – another bullish mark for long-term investors.
However, it’s not all smooth code for Big Blue. The 50-day simple moving average at $248.02 is still above the current price, and the Moving Average Convergence Divergence (MACD) indicator is at a negative 2.18, signalling a bearish setup. With a Relative Strength Index (RSI) reading of 50.01, the stock isn’t showing any strong momentum either way.
Investors may want to keep an eye on post-earnings action to confirm direction.
IBM Analysts See 17% Upside
Ratings & Consensus Estimates: The consensus analyst rating on IBM stock stands at Outperform currently with a price target of $213.48. The three most recent analyst ratings – from RBC Capital, Jefferies and Oppenheimer – set a bullish tone, averaging a price target of $287 a share, implying a 16.67% upside from current levels.
IBM Price Action: IBM stock was trading at $247.68 at the time of publication.
Read Next:
Image: Shutterstock
Market News and Data brought to you by Benzinga APIs
© 2025 Benzinga.com. Benzinga does not provide investment advice. All rights reserved.